Asset investment decision support · SAP-native
Every number in your capital program, able to face the regulator.
AIPP reads your live asset data and produces a risk-ranked, treatment-aware, multi-year program — each score carrying the range its missing evidence allows, and every funded line traceable from your SAMP objectives through the AMP and service plan down to the asset — with regulator-ready evidence packs generated from the same numbers. Clean-core on your SAP stack. A demonstration on your own data in about two weeks, and a fixed-fee pilot to an accepted evidence pack in 8–12 weeks — not an 18-month program.
Fixed fee, pay on acceptance. If the evidence pack isn't audit-ready, you don't pay.
See it working
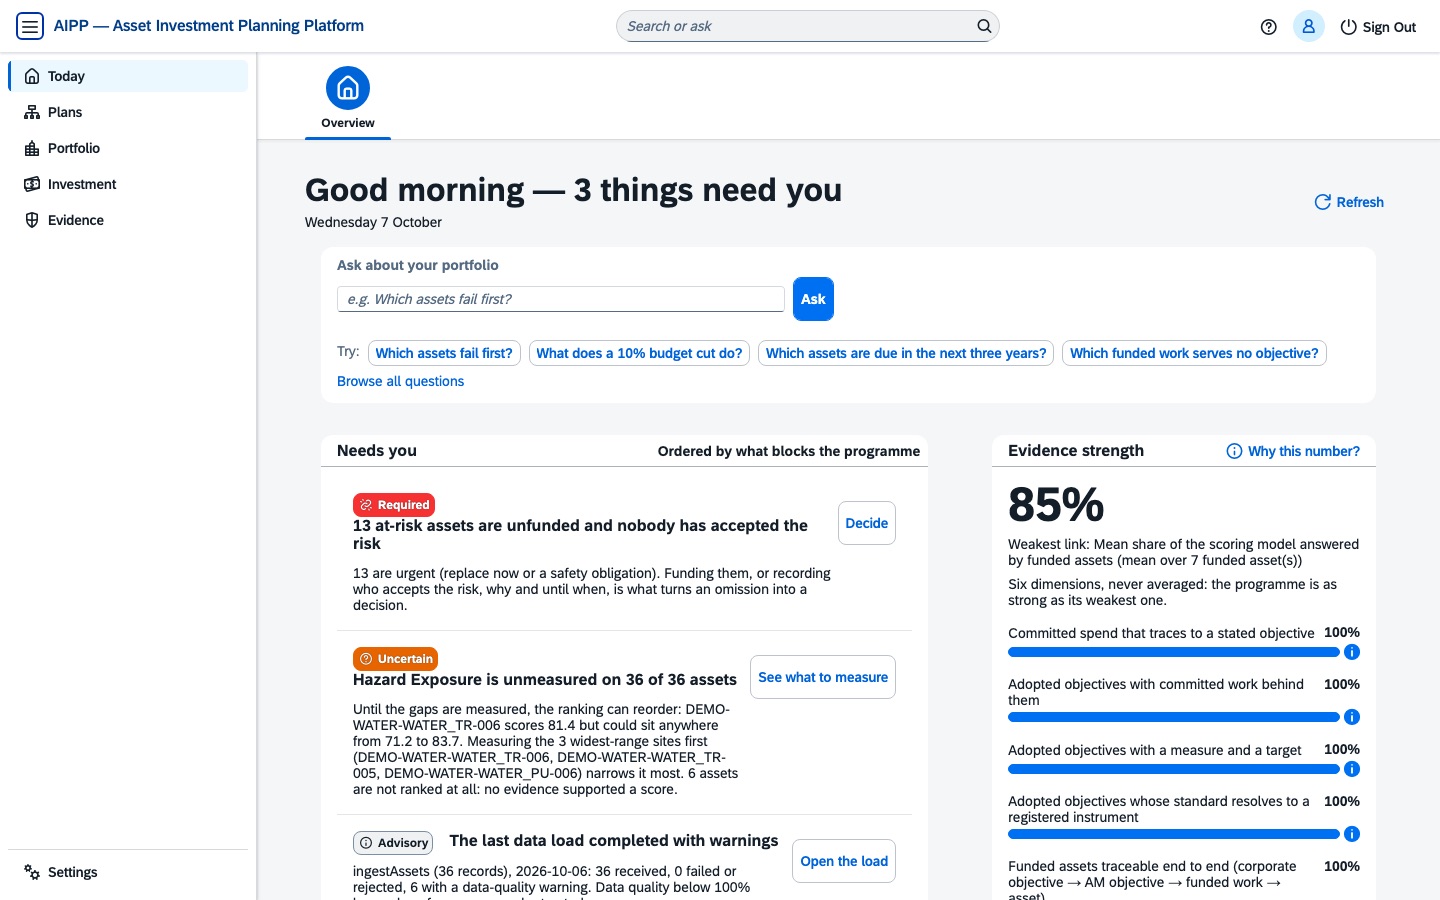
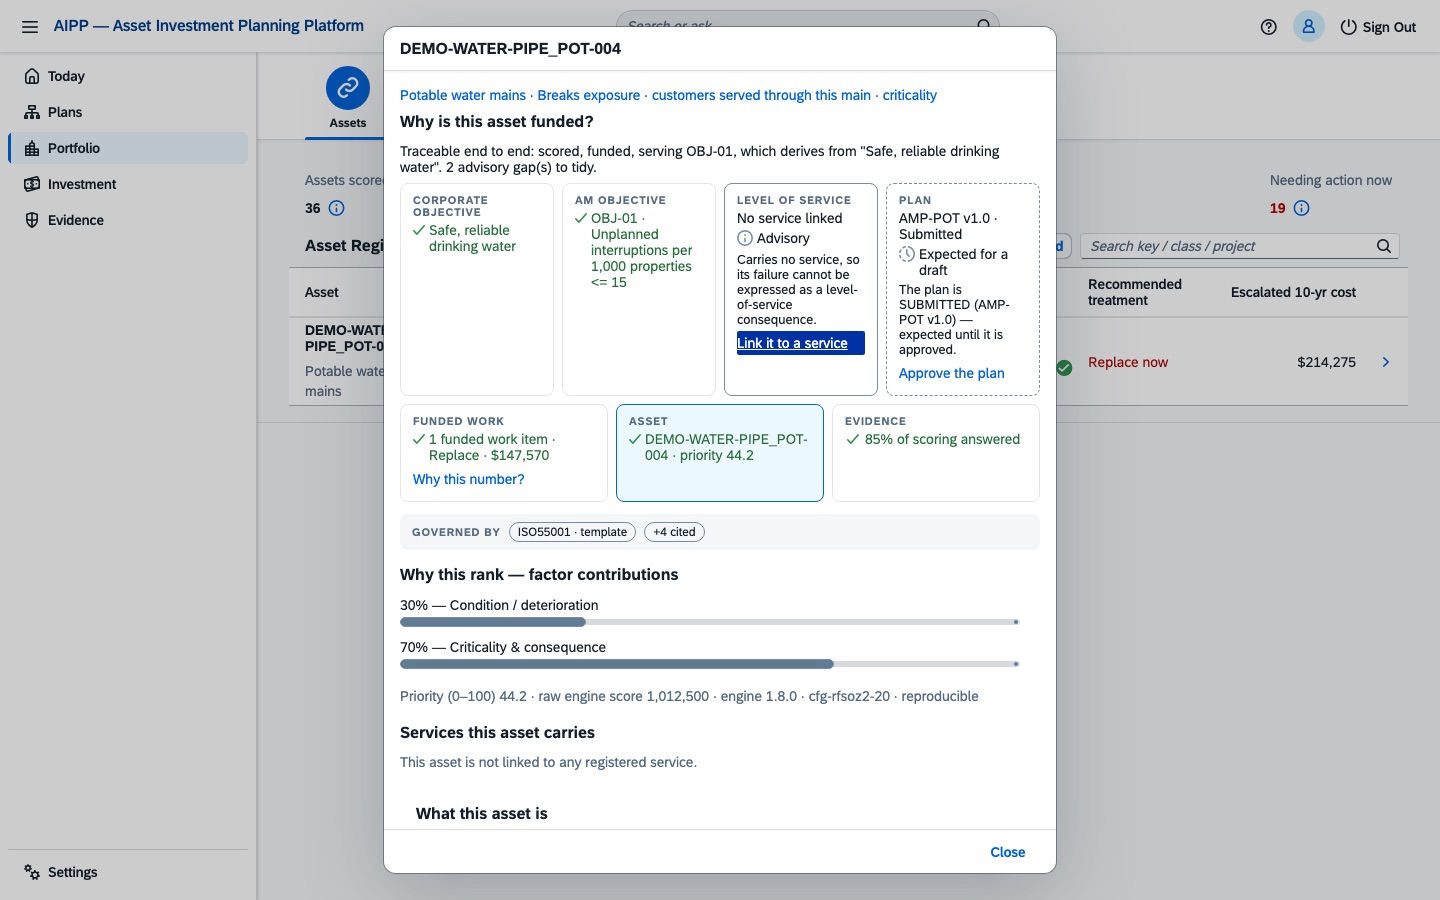
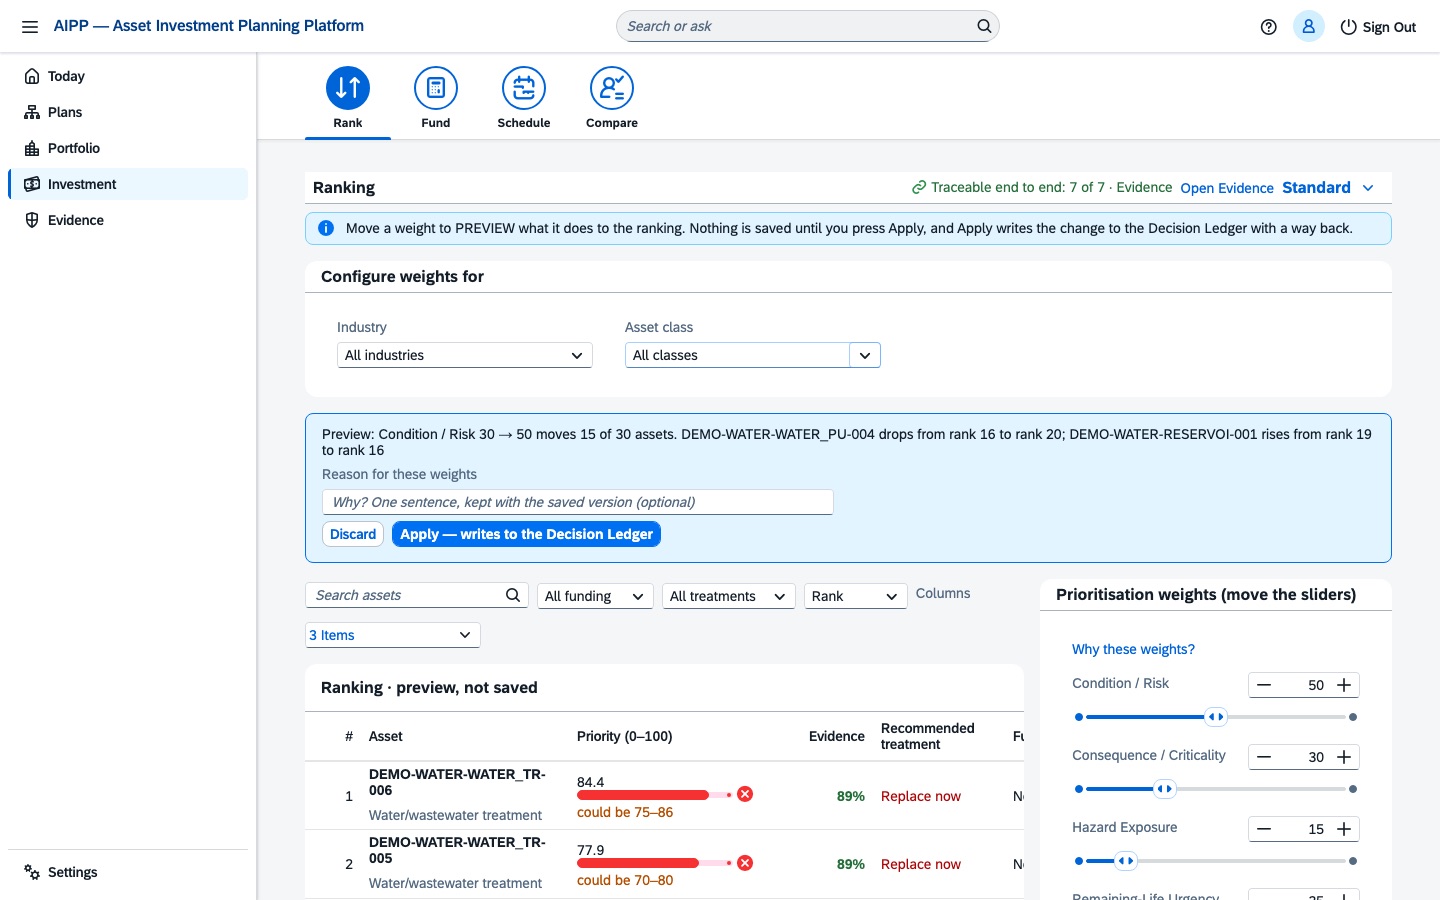
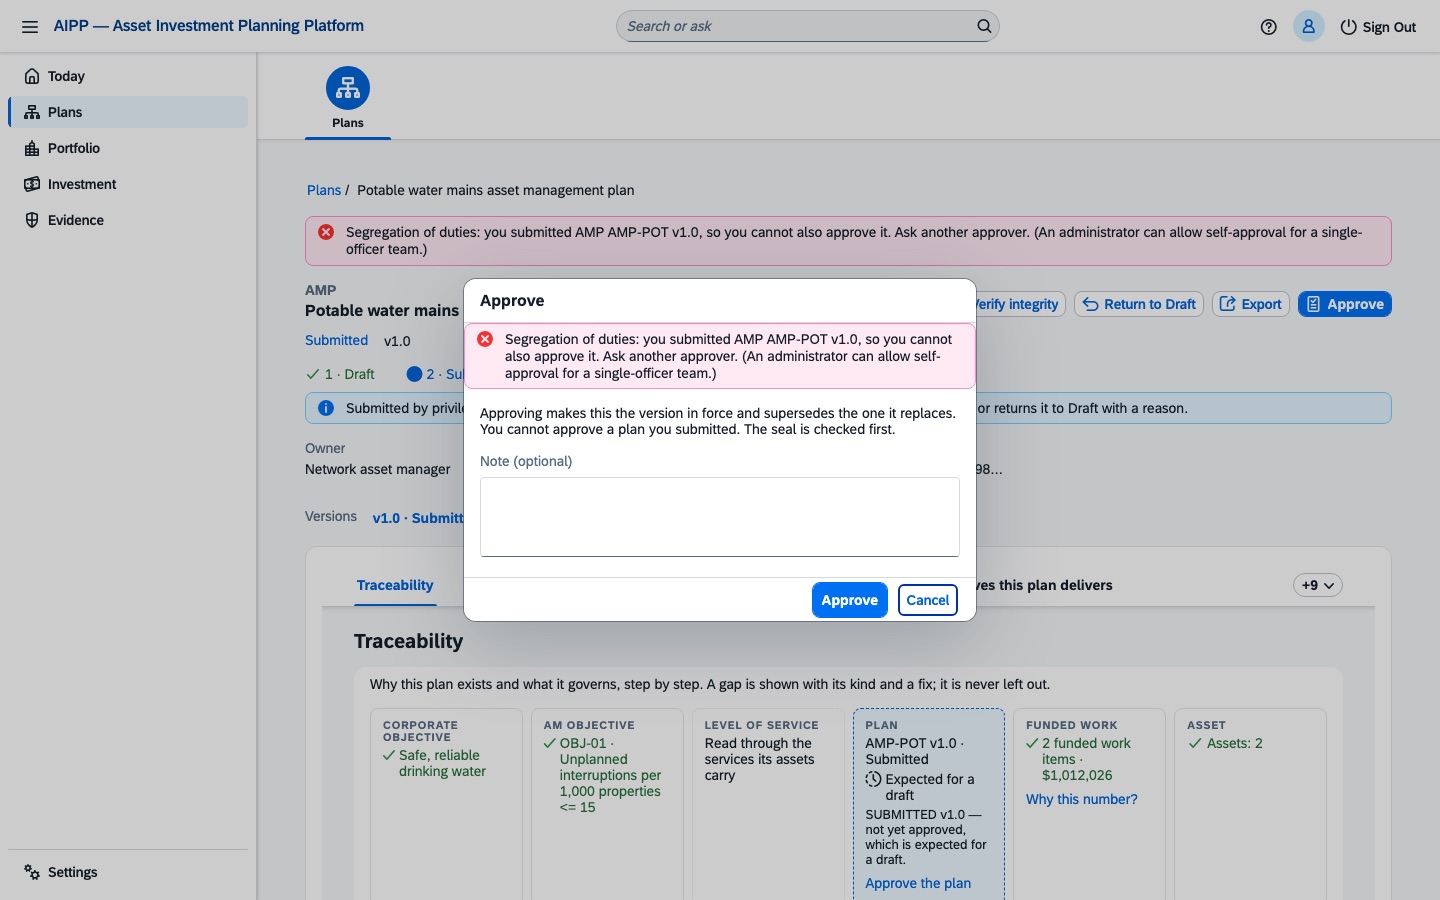
Three minutes of the real application, on synthetic data.
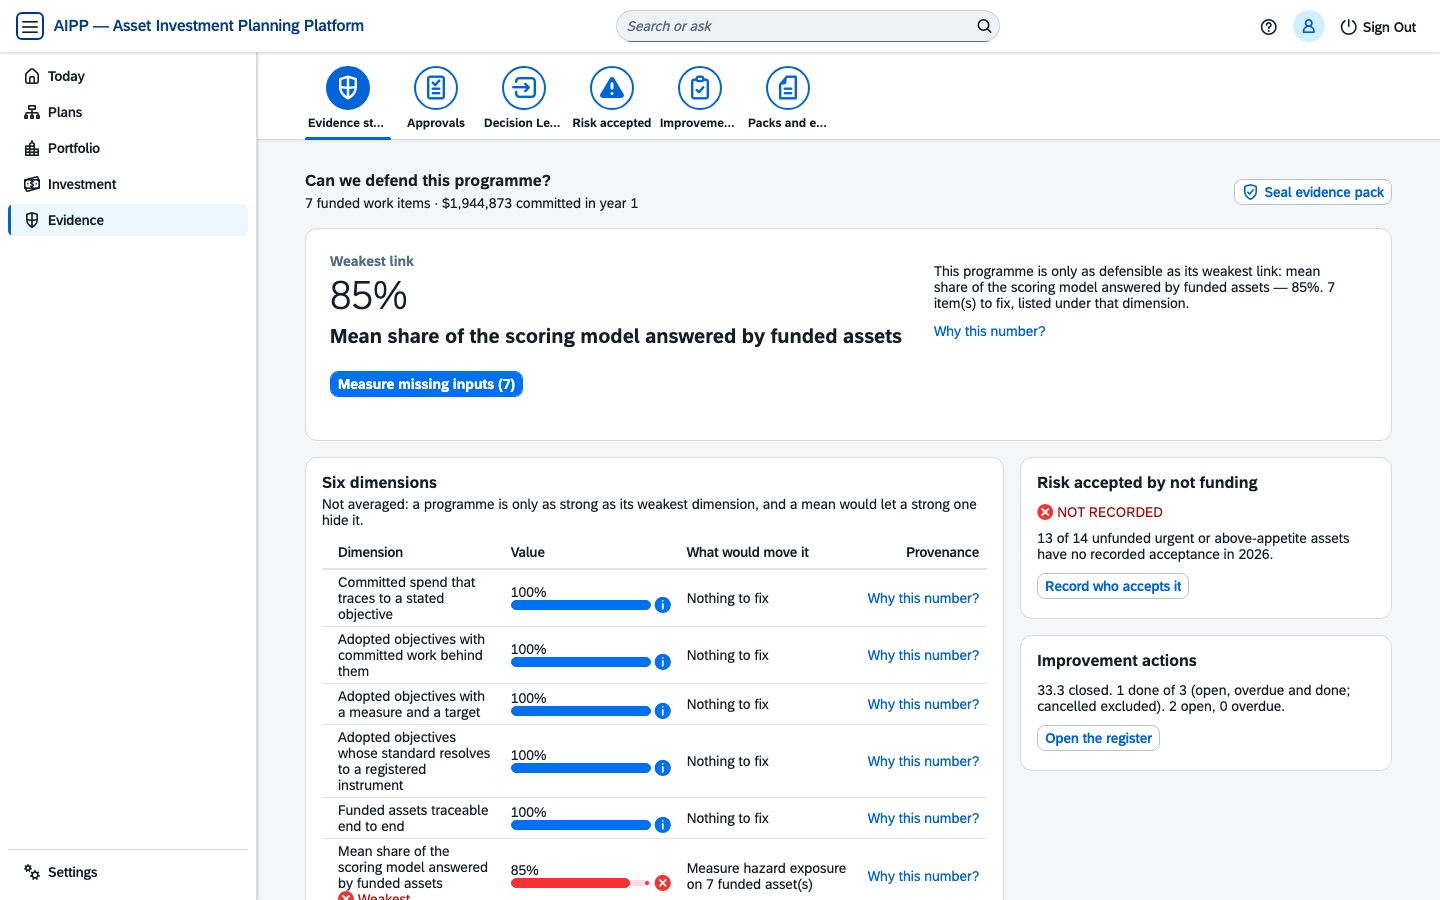
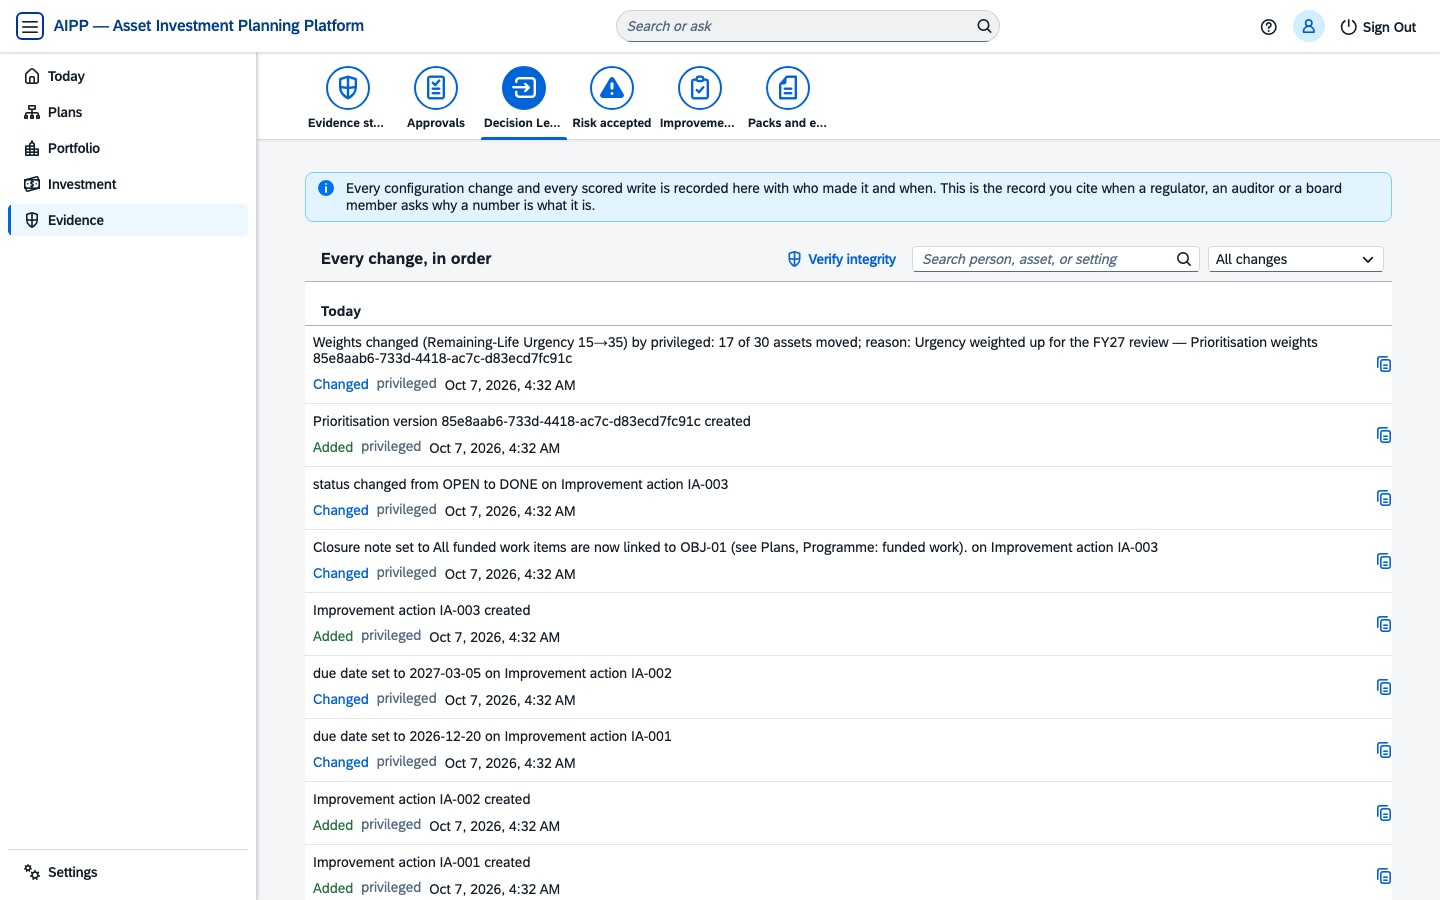
No mock-ups. Every frame is the product itself: a ranked programme, a plan sealed for approval, a refusal to let anyone approve their own plan, and every decision on the ledger.
The claim, and how to disprove it
A decision layer over the asset system you already run — and six ways to check that.
Every vendor in this market claims something, and you have heard it before lunch. So the claim above is written as six verbs, and each one has a test you can run on your own data in an afternoon. Do not take any of it on trust — a claim you cannot check is worth exactly what every other vendor’s version of it is worth.
“Over the system you already run”
Test it: point AIPP at your register — an export will do. If it demands a migration off your EAM, GIS or finance ledger before producing anything, the claim is false. Twelve fields, two of them required.
“Against a real budget constraint”
Test it: set a budget below what the need requires, then halve it. A tool that returns the same list in the same order, only shorter, is sorting. Optimising changes what gets funded, not just how much.
“Cites the governing instrument”
Test it: open any score and ask what it answers to. The instrument should be named, with whether it is implemented or merely referenced stated on the same screen.
“Refuses what the evidence won’t support”
Test it: load your worst class — the one with the missing condition data and the costs from 2019. If everything comes back scored and the ranking looks clean, it is defaulting your gaps, and you have learnt more from that than from any demo.
“States what it doesn’t know”
Test it: take two assets with the same score, one fully inspected and one missing half its data. If both show one confident number, the tool is hiding its uncertainty. AIPP shows the range each score could occupy once the gaps are filled — and which single survey narrows it most.
“Traces every dollar to an objective”
Test it: pick any funded line and ask which strategic objective it serves. If the answer lives in a slide rather than the system, the chain is broken. AIPP reports it both ways: adopted objectives with no money behind them, and money committed against no stated objective.
What would disprove the fourth one: a competitor that also declines to score an asset with no evidence, rather than defaulting it to zero or to a middle grade. We have not tested that against anyone and we will not claim we have — so ask whoever you use today what their register shows for an asset that has never been inspected, and judge for yourself.
Don’t take the claim. Test it.
Load your worst asset class — the one with the missing condition data and the costs from 2019. Watch what the tool says about it. If it scores everything and shows you a clean ranking, it is lying to you, and you have learnt something more useful than any demo could tell you.
Where we are weak, in writing: this is a young product, so if your procurement weights reference customers heavily that is a fair reason to rank us lower. The shipped risk coefficients are representative figures until calibrated against your failure history. CNAIM constants and API 581 damage factors come from those documents and from you — we ship the method, not the tables. And AIPP decides what to fund; it is not an EAM and does not execute the work.
Who it's for
Built for the people who own the risk.
Capital planning fails in the seams between roles. AIPP is written for each seat at the table — pick yours.
Asset & Engineering Managers
The register is 70% right and 100% relied upon. Rank what to fix first — and prove why.
Your page → TechnicalEAM / GIS Technical Leads
SAP functional locations and GIS asset IDs that never reconcile. Clean-core, federated, released APIs only.
Your page → GovernanceData Governance & Compliance
ISO 55000 alignment and ISO 8000-8-style measurable data quality — with provenance on every figure.
Your page → ProcurementPanel & Tender Evaluators
The SCM0020-style credibility checklist, answered honestly — including what's still pending.
Your page → ExecutiveCFO · COO · CIO
Capital efficiency, quantified deferral risk, and a business case your audit committee can interrogate.
Your page →What it does
From asset register to board paper, one traceable line.
Risk on every asset
Likelihood × consequence engines per class — representative for roads, bridges and rail; burst, CCTV, vegetation and structural models for water, sewer, electricity, facilities, fleet and marine. IIMM 1–5 condition grading throughout.
Value-ranked programs
A monetised value model (risk, service, safety, financial) ranks treatments by value-per-dollar. Budget what-ifs, an efficient frontier that shows where returns flatten, and a multi-year optimiser that prices the cost of deferral.
Evidence, sealed
Every score decomposes into its factors. Plans freeze into named baselines and diff year-on-year. Evidence packs seal with SHA-256 — anyone can re-hash the payload and verify nothing changed.
Standards posture
Aligned, measured — and honest about which is which.
Asset management
Reproducible decision runs, factor decomposition and authorised sign-off — the line-of-sight evidence ISO 55000 asks for, generated as a by-product of planning rather than a documentation project.
Measurable data quality
Data quality is scored per record against configurable, critical-weighted rules across DAMA dimensions — an auditable, ISO 8000-8-style measurement, not a vibe. Low-quality figures are visibly hedged, never silently trusted.
Regulator packs
Six report packs generated from the same scored data. A machine-readable provenance registry states each pack's status — representative, template or scaffold — so you can never over-claim by accident.
The claim we won't make: AIPP is "aligned" with published road and rail methods, and validated against your own standard during onboarding — never "certified" out of the box. The provenance registry in the product enforces that honesty. Regulators notice.
How it lands
Thirty days, three steps, no consulting engagement.
Connect
Spreadsheet export, CSV, API — or a federated live read from SAP S/4 over released OData APIs. Data quality is scored on the way in; incomplete records are ingested and flagged, not rejected.
Configure by industry
Apply your industry pack — water, transport, energy, rail or local government — and the prioritisation weights, value profile and report set configure themselves. Your engineers tune from there, live.
Defend
Freeze the baseline. Generate the packs. Hand the sealed evidence to your auditor, your board or your regulator — every figure traceable to the run, the config and the source rows that produced it.
See it on your own data
A fixed-fee pilot turns one asset class into a ranked program and an audit-ready evidence pack in 8–12 weeks. You pay only on acceptance — and you keep the pack either way.